Universal Analytics Walkthrough
- 5 Minutes to read
- Print
- DarkLight
- PDF
Universal Analytics Walkthrough
- 5 Minutes to read
- Print
- DarkLight
- PDF
Article Summary
Share feedback
Thanks for sharing your feedback!
Currently supported:
Reporting API - Version 3
Management API - Version 4
Please Note:
Effective from July 1, 2023, data processing for all regular Universal Analytics properties will be discontinued. However, 360 Universal Analytics properties that have an existing order will receive a single processing extension, which will conclude on July 1, 2024.
Prerequisite
A valid Google Analytics connection in Rivery.
Pull data from Universal Analytics in Rivery
The data extracted from the Google Analytics connector uses a configuration of metrics and dimensions.
The data is organized into views (profiles), properties and accounts. Views are related to Properties, and Properties are related to accounts.
Rivery allows you to pull data from multiple views by selecting specific views or selecting any property/properties or account/accounts, as data of related views are extracted.
Choose the report type - there are 6 report types available:
The following instructions are relevant for all reports:
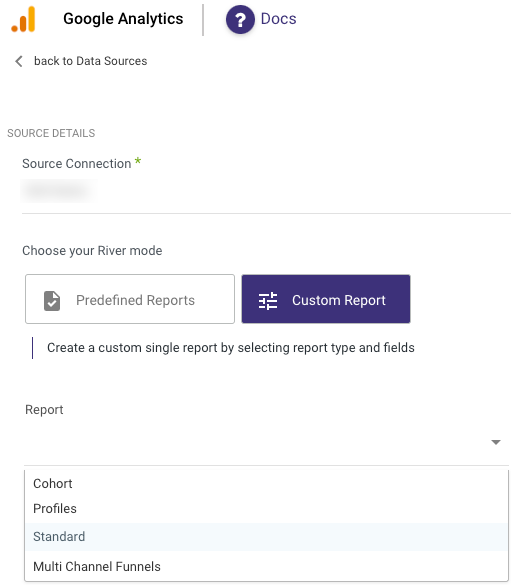
- Select the Google analytics connection or create a new connection according to the instructions above.
Click on “Test connection” in order to make sure the connection is valid. - Select from which view to pull the data:
- Leave the inputs of accounts, properties and views empty in order to pull data for all available views in the given Google analytics connection.
- Click on any of the accounts, properties and views inputs in order to get lists of all available accounts, properties and views. Once the lists are populated you can search for the required values.
- Any selection of an account will filter the values in the lower levels (properties and views) to contain only items that belong to the selected account.
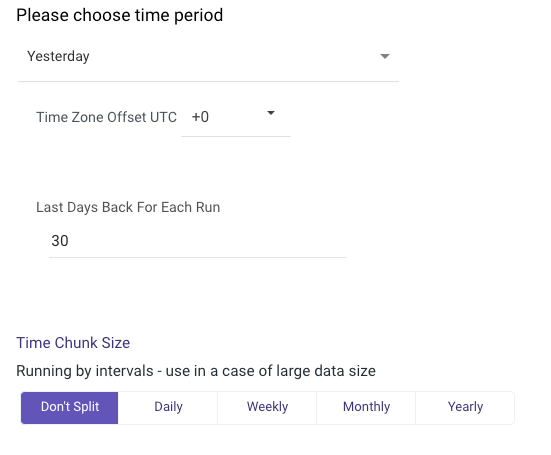
Time period
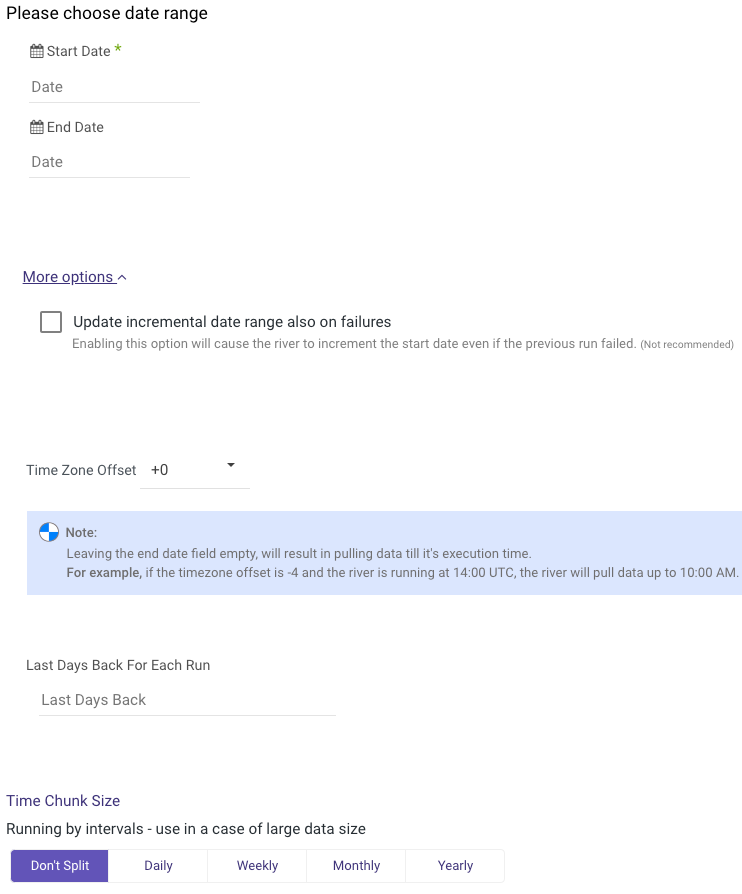
- Select the type of time period of the report. It can be a custom date range (as described in the picture above) or a defined time period shown in the pop-up list (for example Yesterday, last week etc.)

1.Select the start date and end date.
2.Leave the end date empty in order to pull data until the moment the river runs.
3.After each run of the river, the start date will be updated automatically with the end date, and the end date will be updated with the empty value. This enables the next run to pull data from the end of the previous run.
4. Select the time zone offset. It will be relevant only if the end date is empty in order to find the moment of the river’s run according to the time zone.
5. Last Days back - use that input in order to tell Rivery to pull data from a given number of days back before the given start date.
Instructions if selecting any other value:
- Select the timezone offset in order to send the correct dates that consider that offset.
Select the dimensions and the metrics of the report
1.Click on each input in order to see all the available fields
2.Important: There are only specific combinations of Dimensions and Metrics allowed by Google Analytics. If the selected combination is not allowed, you will receive an error message.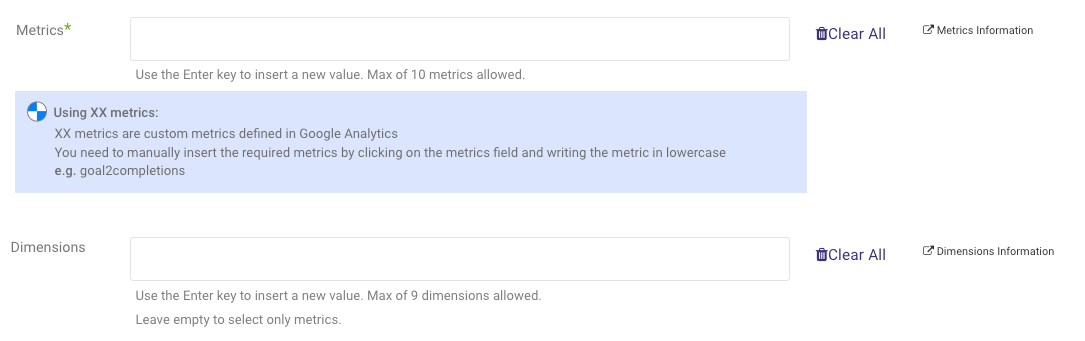
Important note about XX metrics:
XX metrics are custom metrics defined in Google Analytics
You need to manually insert the required metrics by clicking on the metrics field and writing the metric in lowercase. Insert each metric by pressing the enter button.e.g. goal2completions
Make sure to only insert metrics that are defined in your Google Analytics accountImportant note about Dimensions:
In some cases Audience dimensions like "userGender" and "userAgeBracket" can cause significant reduction in the number of entries and total amount of sessions (only rows that contain these dimension(s) will return) due to Google Analytics user privacy policy and limitations.Segment - Click to get a list of all available segments in the given Google Analytics account. Once you choose at least one segment an additional field, segment, will be available in the mapping which defines the set of each record broken down by segment. E.g., the following table shows each record received for a given segment. In this use case the set of New Users is part of the set of All Users.
date segment sessions totalEvents 20210710 All Users 1478 33313 20210710 New Users 161 3726 Additional fields - Any selected fields in that list will be added to the results as an additional field. This is useful in case it is necessary to have the details of the account/property/view in each record of the results.
Advanced options -
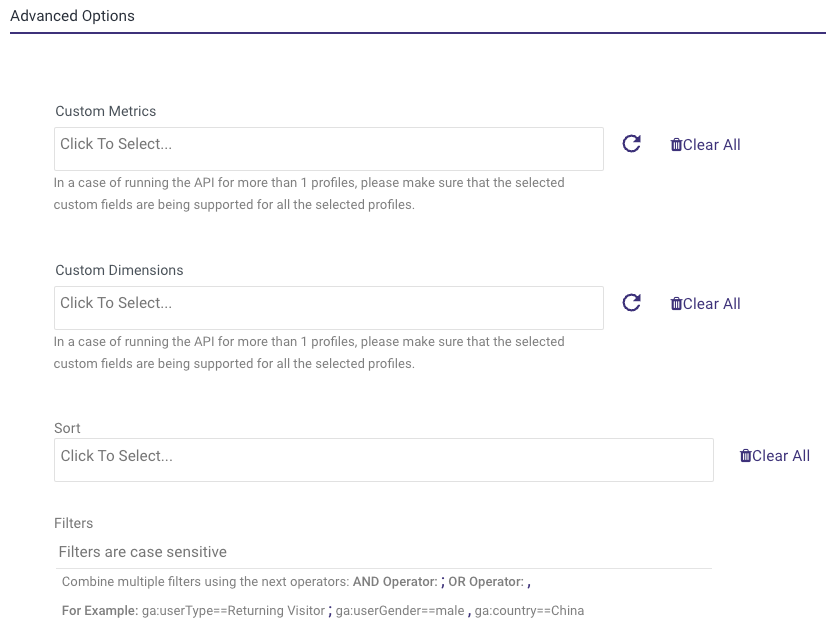
Custom metrics - Click on the inputs to show a list of all available custom metrics of the given Google Analytics connection.
Custom dimensions- Click on the inputs to show a list of all available custom dimensions of the given Google Analytics connection.
Important: If selecting more than one view, the selected custom dimensions/metrics must be supported by all the selected views, otherwise it will cause an error.
Sort - Decide how to sort the results by any selected dimension.
Filters - Decide how to filter the data. You must follow syntax instructions when filtering data:
- == Equal
- != Does not equal
- > Greater than
- < Less than
- >= Greater than or equal to
- <= Less than or equal to
- == Exact match
- != Does not match
- =@ Contains substring
- !@ Does not contain a substring
- =~ Contains a match for the regular expression
- !~ Does not match a regular expression


Troubleshooting
- When analyzing your metrics, keep in mind that some metrics are unique and cannot be combined between different dimensions without knowing what will happen.
If you see a range of time intervals in Google Analytics' UI, for example, 31 days back, to get the exact same values for users and other unique fields, you must set the exact same parameters in your River, with the exception of not selecting "date" dimension, because it will split your data by daily intervals. And choose a time chunk size that will not be split.
Obtaining the number of users from each dimension, for example, may result in an overestimation of the number of real users who viewed your website. More information is available at the following link:
https://support.google.com/analytics/answer/7084499?hl=en
- If your request to the Reporting API fails due to a server error, the response code 500 or 503 is returned.
You can resubmit the request; however, you should not resubmit it more than once if it fails repeatedly.
Google Analytics allows:
- 10 failed server requests per project per view (profile) per hour
- 50 failed server requests per project per view (profile) per day
You use 3 requests per run when running the River. If the number of failed requests exceeds the above limits, you will receive the 429 error:
Quota Error:
The number of recent reporting API requests that failed due to a server error (500 or 503) is excessive.
For at least an hour, you will be unable to access the reporting API.
To avoid being blocked in the future, please send fewer server errors.
Reduce the possibility of a request server error by limiting the date range, the number of dimensions in the request, or the number of metrics in the request.
For more information, consult the Google Analytics documentation:
Was this article helpful?